28
Sep, 2018
28
Sep, 2018
The End of the Tick Size Pilot
After two years, the tick size pilot will end after the close of trading today. While the goal of the tick pilot (increased small cap liquidity) was noble, the preliminary results appear to show that the goals were not accomplished. However, before the industry declares the pilot a waste of time and money (some have estimated it cost hundreds of millions of dollars), it’s important to realize that the pilot has yielded two years of data which can now be analyzed by researchers. We hope that the analysis not only shows what worked and what didn’t work but also gives reasons for certain failures.
The tick pilot was complicated with its three buckets which each had different rules. Some observers have speculated that the reason for the lack of increased trading in tick pilot stocks was because broker order routers failed to adjust to the increase in displayed liquidity at each level. In other words, these routers continued to piece small child orders into the market even when more displayed liquidity was available. Back in July of this year, FINRA and the exchanges (we’ll refer to them as FINRA for the rest of this note) published a preliminary analysis of the tick size pilot which was produced by an outside consultant. FINRA found that:
Depth of Book
“With respect to liquidity, the primary effect of the wider trading increment seems to be a clustering of more displayed trading interest at the fewer available price points.”
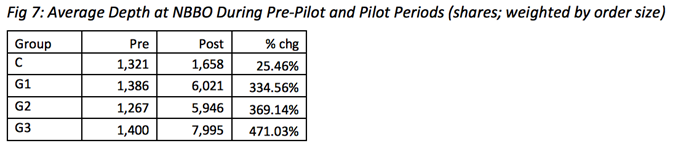
Notice that the largest increase in displayed liquidity was in Group 3 which contained the trade-at rule. FINRA concluded “the trade-at prohibition likely spurred more on-exchange quoting at the NBBO from market participants who otherwise may have matched the NBBO off-exchange.”
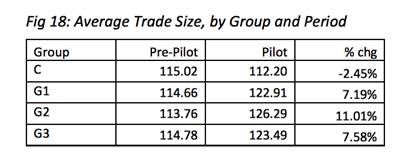
Average Trade Size
While displayed quotes increased dramatically since the price points were aggregated, the same didn’t hold true for average trade size. According to FINRA, “Average trade size fell by 2% for the Control Group, compared with increases of 7% and 8% for Groups 1 and 3, respectively and 11% for Group 2 These changes, however, were not statistically significant.”
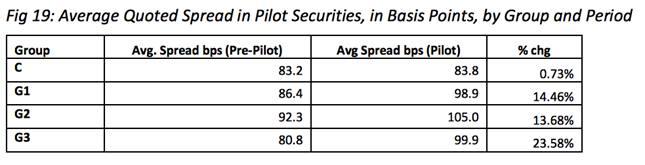
Spreads
It’s important to remember that prior to the tick pilot, nearly two thirds of the securities in the pilot already had a spread greater that a nickel. The goal of the pilot was not to increase spreads but rather to increase the quoting increment. However, according to FINRA, spreads did increase:
“Quoted Spreads for all Test Group securities increased substantially compared with the Control Group.”
However, when you dig a little deeper, you can see that spreads actually narrowed in stocks that had a spread of greater than 5 cents before the pilot began:
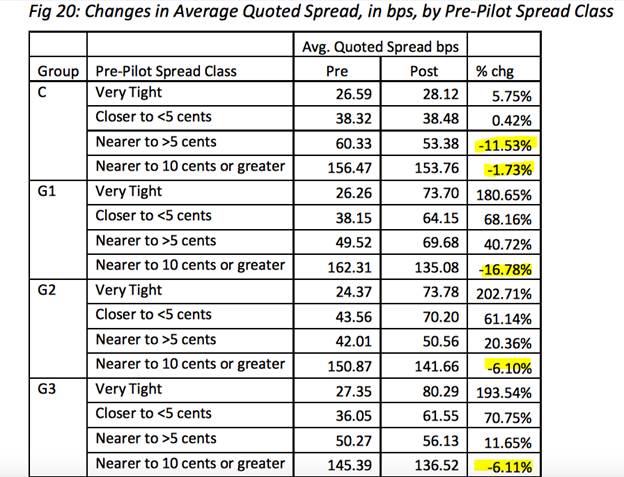
We have outlined just a few of the preliminary results and we are hopeful that the two years of data will produce more detailed conclusions. In their preliminary analysis, FINRA concluded:
“In summary, lower-priced, higher-volume securities with the tightest pre-Pilot spreads experienced wider quoted spreads, longer inter-market price-time priority queues and greater fragmentation of trading volume as a result of the Pilot treatments….In contrast, higher-priced, lower-volume stocks with the widest pre-Pilot spreads tended to experience the biggest reductions in quoted spreads and were not as affected by greater fragmentation caused by longer queues.”
This conclusion is far from saying the pilot was a failure. In fact, since there is now two years of data for researchers to analyze, we don’t think that saying the tick size pilot was a failure is accurate. It has produced results which could hopefully lead to market structure improvements in the future. And for that reason alone, we think the pilot was a worthy undertaking.
